What’s the hang up? Video Transcript
Lesson 3. Bottlenecks. As we learned in Lesson 2, supply chains function to move supplies and products in the most efficient, cost-effective manner. We also learned that changes anywhere in the network have a rippling effect up and down the supply chain. But every supply chain has a weak link. Any disruption, slow down, or change in demand at that level in the supply chain will cause a hang up of the goods in the flow.
A hang up can have serious implications if the products and services produced are essential to the lives of people around the globe, as in the case of intravenous saline bags manufactured in Puerto Rico.
As you engage in this lesson, think about these questions:
- How would you map out your relief supply chain?
- Where could be the bottleneck or bottlenecks that are preventing you from receiving something you ordered?
- What might be the vulnerable links for supply chains that operate in your jurisdiction?
Let's get started.
Lesson 3 Objectives
Objectives: At the end of this lesson, you should be able to:
- Describe how capacity and utilization rates are used to monitor a supply chain’s ability to meet demand
- Describe a bottleneck and its effect on supply chain flow
- Explain how bottlenecks can shift unexpectedly
This lesson should take approximately 25 minutes to complete.
Why is there a vulnerable link?
- It is important to understand that the weak link in a supply chain is not an underperforming entity. In fact, it is the link that regularly performs at peak capacity. The maximum rate at which a supply chain process stage can produce or move a product is called its capacity.
- Supply chain managers regularly monitor the ability of different process stages to keep up with demand. Process stage capacity and utilization are essential measures to determine the velocity of the supply chain flow. Let’s learn more about these concepts.
Process Stage Capacity: Video Transcript
Hello. My name is Pinar Keskinocak. I am a professor in the School of Industrial and Systems Engineering and the Director of the Center for Health and Humanitarian Systems at Georgia Tech. I have extensive experiences in research, teaching, and projects in supply chain management both in the context of regular supply chain operations and also disaster preparedness, response, and recovery.
In the first couple of months of 2020, there was a sudden surge in demand for Personal Protective Equipment, or PPE for short, that overwhelmed the industry. Unlike toilet paper, where the demand was inflated mostly due to consumer hoarding, the higher demand for PPE was due to a real fundamental shift and actual higher need for PPE during that time.
In February and March of 2020, it was estimated that the global demand for PPE was 100 times higher than in the past. Despite significant efforts, PPE production capacity continued to lag about 40 percent behind demand even after 6 months.
So, with the goal of reducing the lead time, both for PPE and for COVID-19 vaccines, arrangements were made to expedite transportation. But the transportation push alone was not sufficient for meeting the demand for these products because manufacturers were unable to increase their upstream production capacity. Though rapid response helped reduce the gap between supply and demand, but it was not sufficient to close the gap completely.
Demand / Capacity = Utilization
- How can you tell if a process is producing enough to meet demand?
- Supply chain managers use the term “utilization” to describe the productivity of a process in relation to demand. They calculate utilization by dividing demand by capacity. The resulting ratio is the utilization rate. It is often stated as a percentage.
- When the process is working at its highest capacity and is busy all the time, its utilization ratio is 1:1, or 100%. When the process is working slower or has interruptions, the percentage is less.
- Under normal conditions, the most heavily utilized process stage (the bottleneck) will always have utilization of less than 100 percent. Otherwise, an ever-increasing backlog of demand would build up, which is obviously unsustainable.
Limiting the Flow: Video Transcript
A “bottleneck” is the supply chain process stage that has the highest utilization. A bottleneck can occur in the supply, manufacturing, transportation, or other process stages. The flow moves quickest through the bottleneck stage because it is most efficient.
We can see something similar happen if we watch sand pass through the throat of an hourglass. The sand moves quicker as it passes through the narrow opening.
But, because it has limited room to expand output before it reaches its maximum capacity, the bottleneck limits the flow of products through the chain. When demand increases beyond the stage’s maximum capacity, it becomes overloaded, and supply can’t match demand. However, a process stage doesn’t need to be overloaded all of the time to be a bottleneck.
It is important to understand that most bottlenecks are designed into the system because they can speed high-volume supply toward dense demand. But when they are disrupted—or when physical or functional elements are destroyed—the same concentrations that once created efficiency can become the factors that limit the flow through the supply chain.
Identifying Bottlenecks
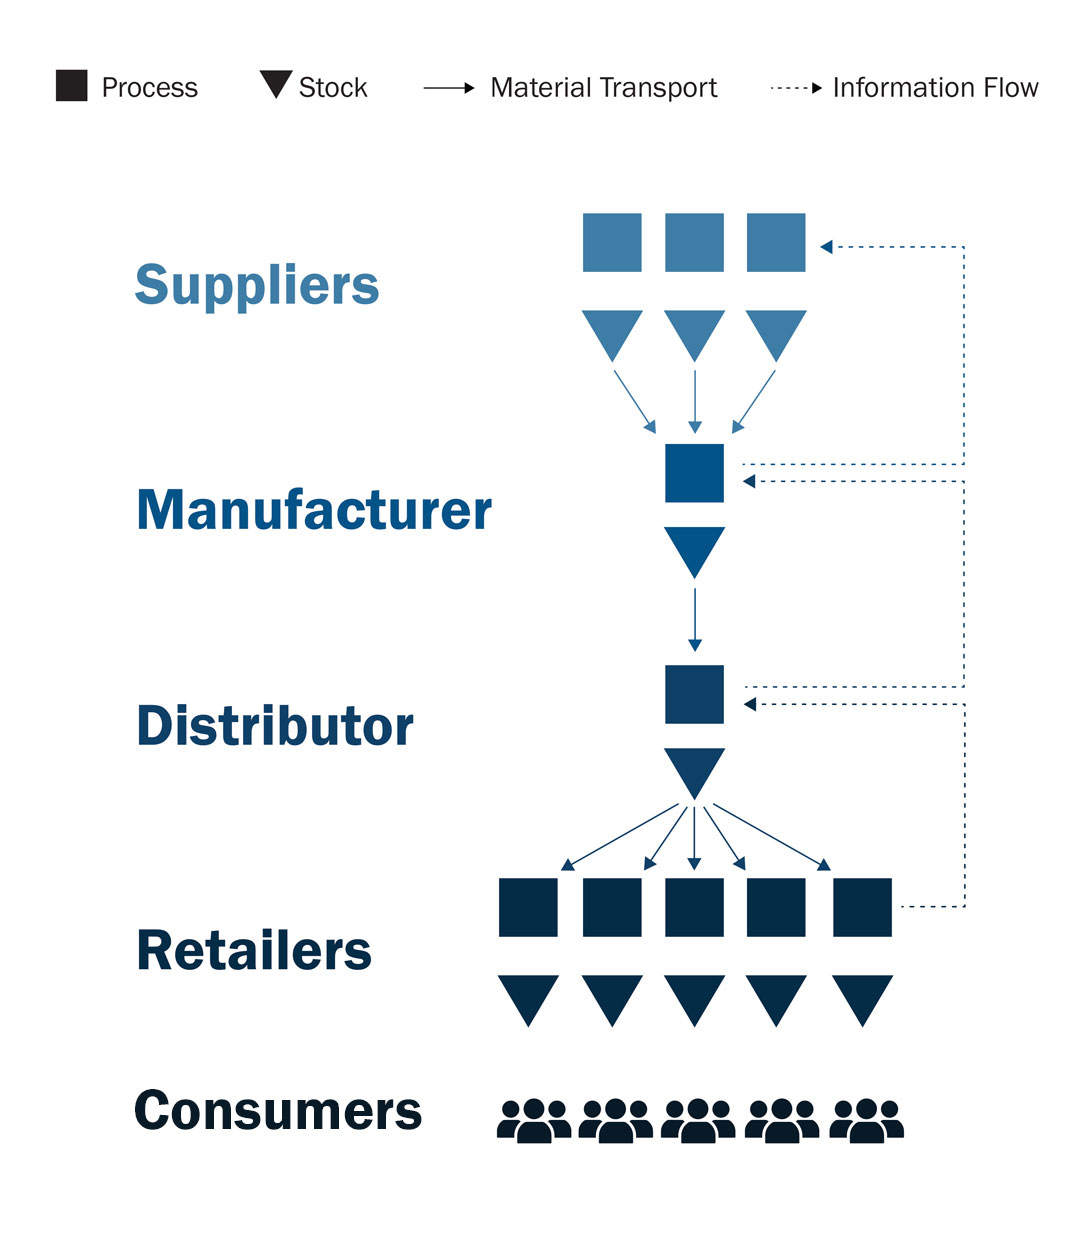
Creating a supply chain map can help to identify the bottleneck(s) in the system. Let’s map the table supply chain as an example. Multiple suppliers provide raw materials and components to the table manufacturer. The sole distributer transports the tables to multiple furniture retailers that serve a large consumer base. It is easy to see the hourglass shape in the diagram.
Bottlenecks and Lead Times
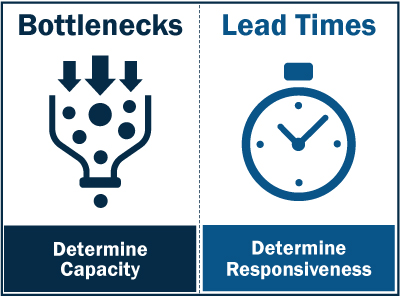
Under normal conditions, the capacity of a supply chain is determined by its bottlenecks, while the responsiveness of a supply chain is determined by its lead times.
Bottlenecks are Dynamic
- Utilization rates of the various supply chain process stages will naturally fluctuate. Fluctuations can be caused by changes in staffing levels, a change in consumer demand, the mix of products in the supply chain, and other parameters.
- When the utilization rate of a different process stage surges beyond its capacity to meet demand, this can cause the bottleneck to shift. For this reason, supply chain managers need to be aware of “near bottlenecks,” where a stage is approaching 100% utilization, because it can easily become the next bottleneck in the system.
Bottlenecks are Dynamic: Video Transcript
Do you recall the table supply chain example from Lesson 1? Let’s see how a bottleneck moves through this supply chain when an ice storm creates an extended power outage that halts the screw supplier’s operations. We will see how the flow of products is first limited and then halted by shortages upstream.
The squares indicate the process. The triangles indicate inventory. The solid lines indicate the flow of materials, and the dotted lines indicate the flow of information. Empty symbols indicate a disrupted supply chain component.
Day 1. After the ice storm, the screw supplier is unable to fulfill its scheduled order. The other suppliers are unaffected. The table manufacturer’s production capacity is reduced because of the lack of screws. It completes as many tables as it can using existing inventory. The distributor is able to meet retailer demand. The consumers are unaffected.
Day 3. The screw supplier is still closed. The table manufacturer has the capacity to produce tabletops but cannot assemble any tables. No finished tables are shipped to the distributor. The distributor’s inventory capacity is still sufficient to meet retailer demand. Consumers are not affected.
Day 7. The distributor has exhausted its inventory of tables and cannot fill any retail orders. Retailers are able to meet consumer demand using store inventory stockpiled for the upcoming back-to-school season. Consumers are not yet affected.
Day 12. Back-to-school season begins, and college students are eager to furnish their new apartments. Several retailers do not have tables in stock. This places pressure on the remaining retailers. Consumers are affected by the table shortage.
Major Disruptions in Concentrated Areas
- When physical or functional elements in a process stage, like machinery or a transportation facility, are destroyed, the same concentrations that facilitated efficiency can become a squeeze point and reduce flow to a trickle.
- When the COVID-19 pandemic demand first began to spread across Asia, factories were shut down as workers became ill or were quarantined. Computer chip manufacturers are concentrated in China, and the multi-month shutdown turned off the flow of chips to American car, appliance, and other manufacturers.
- To compound the shortage, the pandemic reduced the already low number of truck drivers available to move shipping containers of chips from West Coast ports to manufacturers across the nation. What had once been a profitable choice became a liability as the effects of pandemic-induced disruptions were felt across the entire supply chain ecosystem.
Major Disruptions in Concentrated Areas: Audio Transcript
Hello, I'm Jarrod Goentzel, Founder and Director of the Humanitarian Supply Chain Lab in the MIT Center for Transportation and Logistics.
Our lab mission is to design and manage supply chains to best meet human needs by studying the resilience of private sector operations, and creating decision support systems for government and NGO efforts to fill gaps. I have a story that illustrates supply chain interdependencies and the cascading impact of bottlenecks.
Saline bags are an essential health product in delivering medicines intravenously or as a hydration, resuscitation, or irrigation fluid. Ahead of the 2017 hurricane season there had been increasing shortages of saline bags globally. Only three companies manufactured all the saline bags used in the U.S., and one manufacturer based in Puerto Rico produced 40% of that supply. They produced it at two plants in two cities on the island. Following Hurricane Maria in September 2017, the island's electrical grid failed and it took months to restore power, even in high priority areas. It took seventy days for power to be restored to these two saline manufacturing plants. During that protracted power outage, the plants resorted to using onsite emergency generators. These generators were often used for intermittent power outages, but not for extended use. With the power out, the companies' diesel fuel consumption really skyrocketed, as did other businesses and residences with generators, and so their fuel vendor did not have the capacity to deliver. While the island was able to scale up the maritime supply of fuel into terminals through domestic and international providers, the capacity to distribute that fuel on the island to meet the surge and demand was not sufficient. In addition, service parts and service techinicans for generator maintenance were difficult to find.
Company attempts to obtain fuel through FEMA were unsuccessful. Even though the request made sense, it was difficult for their contact at the Joint Field Office to provide support to this private sector entity since it was not officially designated as a critical national facility, and there were enough pressing problems at the time at the JFO that their requests fell to the side.
The manufacturing plants continued to operate but at a decreased capacity. Meanwhile, a bad flu season in 2017 and 2018, led to a demand surge that created massive shortages of saline products in the U.S. So supply chains have complex interdependencies. Limited distribution capacity in Puerto Rico's fuel supply chain cascaded to create a bottleneck in the medical supply chain serving the entire in the U.S. that year. Poor understanding of these interdependencies ahead of the hurricane meant that private sector manufacturing plants that are critical for national healthcare were not effectively prioritized for support.
It's important to understand various critical supply chains that flow into disaster affected areas as well as the supply chains that flow out of disaster affected areas. Lives were lost, indirectly, due to lack of saline bags that year, and it is difficult to account for those losses.
This case study appeared in the Center for Naval Analysis report, Supply Chain Resilience and the 2017 Hurricane Season: A collection of case studies about Hurricanes Harvey, Irma, and Maria and their impact on supply chain resilience (2018).
Vulnerability
- Vulnerability measures the likelihood that a node or link will be disrupted. For example, a production facility in a hurricane-prone region is more vulnerable than a facility that is not in a hurricane-prone region; and a facility with a sophisticated fire protection system is less vulnerable than a facility without.
- Water treatment, pumping, and wastewater facilities are vulnerable to flooding because of their need to be near waterways.
- Gas stations and grocery stores are vulnerable to power outages, payment system crashes, and demand surges.
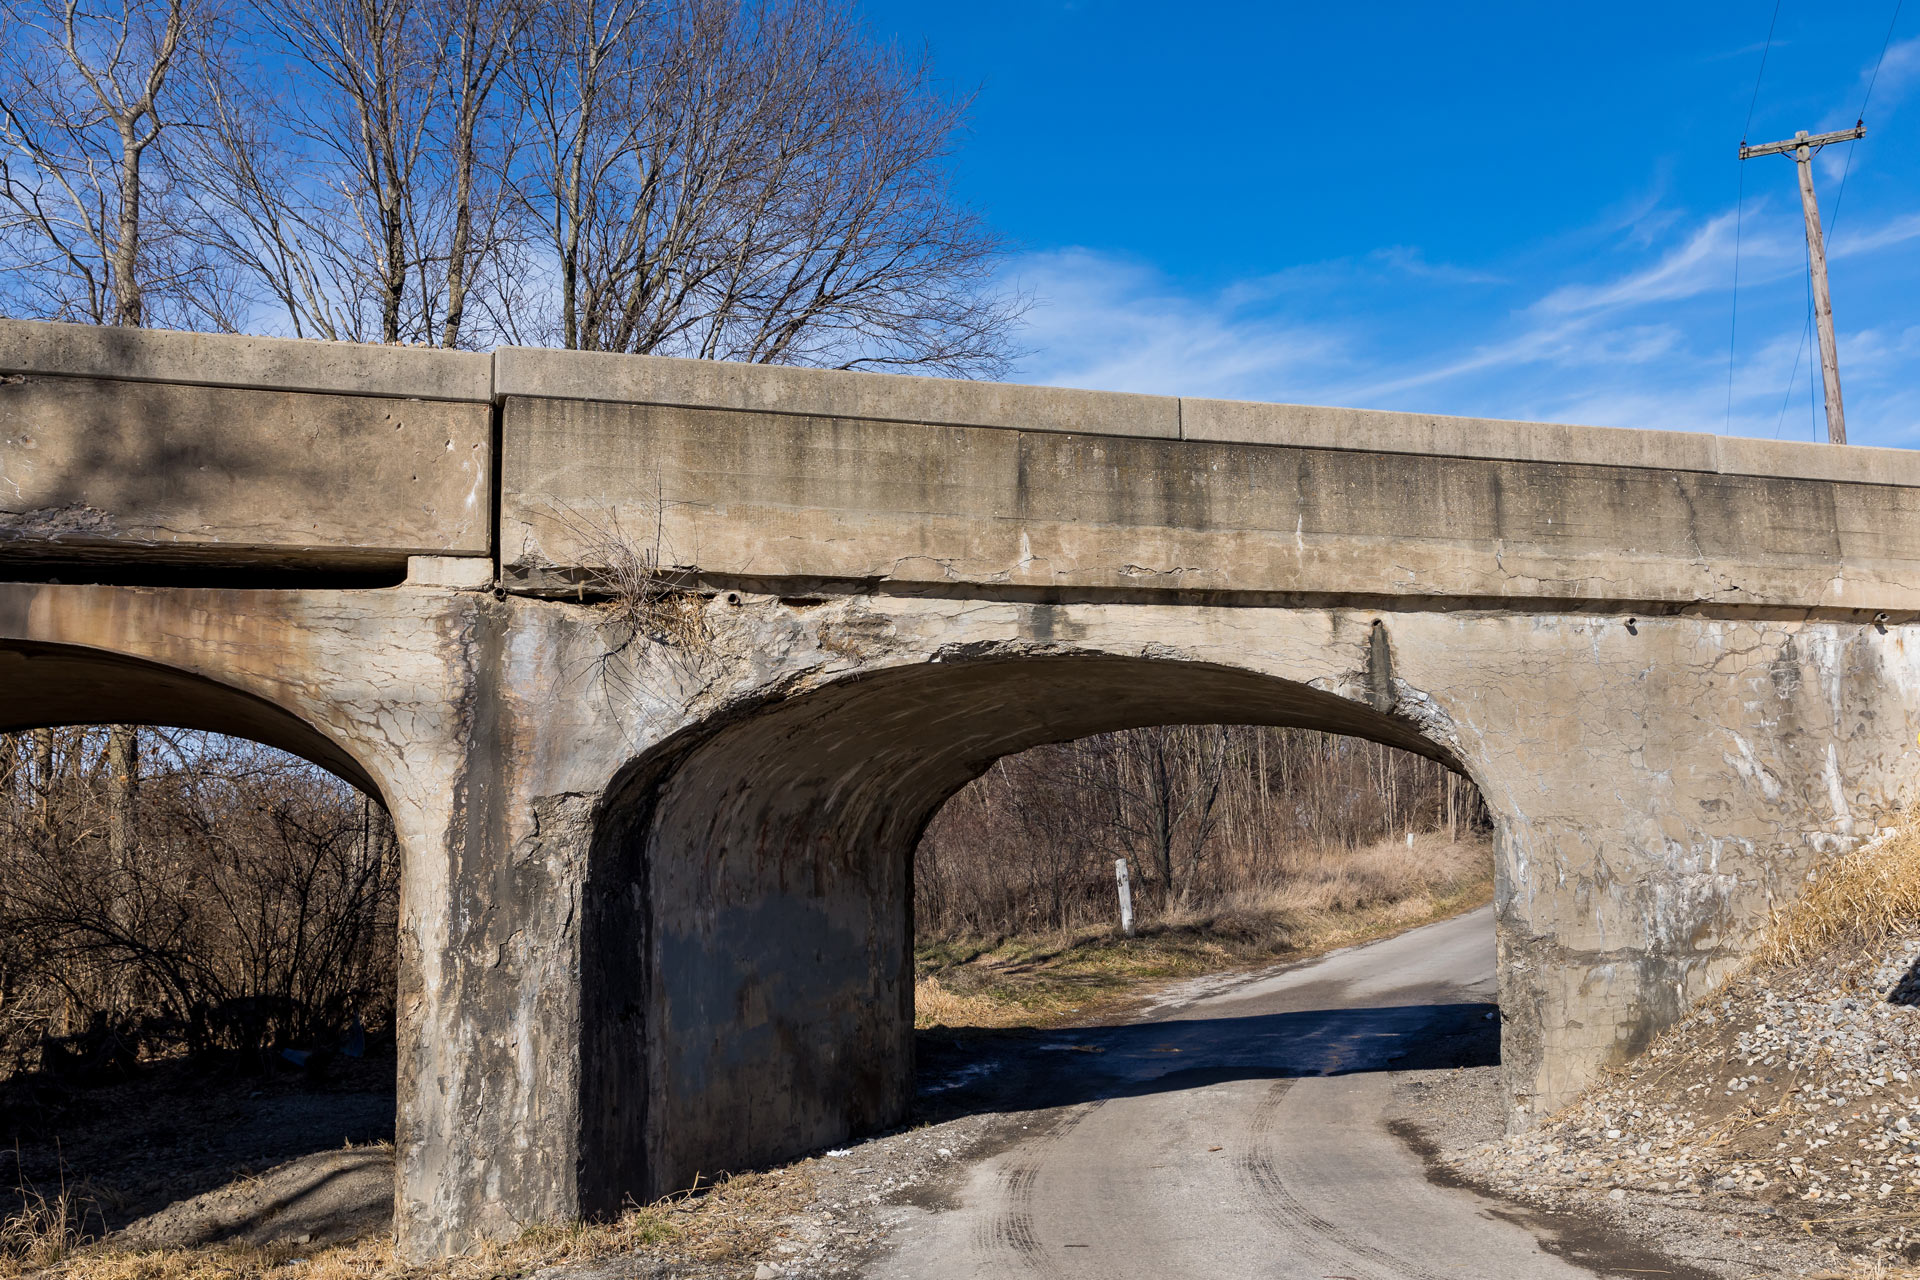
- A large percentage of the country’s bridges, including many that carry interstate highways, are in advanced stages of disrepair. This is a vulnerability for ground transportation networks.
Criticality: Video Transcript
As we learned earlier, supply chains are complex networks.
To visualize the network, we can draw a diagram to show each element, or “node.” Every stop that the product makes between raw materials and the end consumers is a node. Nodes are shown here as dots or circles. Transportation and information systems provide the links to the different nodes. They are shown by the lines that connect the nodes.
While they are interdependent, some nodes and links are more critical to the supply chain. The criticality of a node or link is determined by how much the functionality of the network will be degraded if the node or link experiences a disruption. A node or link is critical to the supply chain if a severe bottleneck will develop if it experiences a significant reduction in capacity. Supply chains can have multiple critical nodes or links.
For example, the production process of a sole-sourced component is more critical than that for a multi-sourced component because other suppliers can meet much of the demand.
Parts of the national and international transportation network (especially, ports, key roads, and bridges) are critical to many supply chains. They have a fixed capacity to serve multiple supply chains simultaneously and can become overwhelmed when flow surges for different supply chains at the same time.
Vulnerability and Criticality
A node or link that is both critical and vulnerable constitutes a major source of risk that a disruption could cause adverse impacts on a supply chain. Addressing such risks is a key opportunity to make a supply chain more resilient.
Vulnerability and Criticality: Audio Transcript
Hi, this is Phil Palin. I'm the son and grandson of grocers. I also work supply chain resilience issues with many public agencies and private firms.
The retail sector, including grocery, relies heavily on telecommunications to process sales with credit, debit, or electronic benefit transfers. These digital payments typically, sometimes automatically, pull new orders and may even shape delivery schedules.
Puerto Ricans are accustomed to hurricanes, and many commercial operations have invested in generators to keep power flowing for lights, refrigeration, and telecoms. But 2017's Hurricane Maria took down most of the cell network and related internet connections. The loss of telecoms limited sales to cash transactions at many retail outlets for the first 4 to 6 weeks after the hurricane. This was especially tough on the 40% of Puerto Ricans who buy food using Department of the Family's electronic benefit, or PAN card. Many people ran out of cash. Some stores resorted to store-credit that would be repaid when PAN cards could be accepted again.
After a month, about a third of the island's cell sites had come back online, but these were usually concentrated in urban areas. Despite many systemic and creative workarounds, about 5 percent of PAN card users, or nearly 90,000 people, were still shut out of the system and did not have a regular source of food, even 6 weeks after the hurricane.
Telecommunications conductivity is a critical link in the grocery supply chain and most supply chains.
This case study appeared in the Center for Naval Analysis report, Supply Chain Resilience and the 2017 Hurricane Season: A collection of case studies about Hurricanes Harvey, Irma, and Maria and their impact on supply chain resilience (2018).
Think About Bottlenecks
While this course does not prepare you to have the following discussions with representatives from supply chain companies, it is important to begin thinking about potential bottlenecks in supply chains that operate in your jurisdiction.
- What are the critical supply chains in your jurisdiction (e.g., food, water supply, pharmaceuticals, fuel/power, etc.)
- What could create bottlenecks if they were disrupted?
- Sourcing
- Manufacturing
- Power (electricity, fuel) suppliers
- Information (internet)
- Distribution/Transportation
- Retail
- What functions keeps the flow of products moving through the bottlenecks (i.e., food at truck stops for drivers)?
- Who owns these support functions?
- What actions should you prioritize to harden critical supply chains against disruptions?
- What strategic efforts should you focus on to return the critical supply chains to normal operations?
Lesson 3 Summary
By now, you should be able to:
- Describe how capacity and utilization rates are used to monitor a supply chain's ability to meet demand
- Describe a bottleneck and its effect on supply chain flow
- Explain how bottlenecks can shift unexpectedly


